AI Data Centers, Unpacked
How big are they, really? How much power do they use? And what about water? See for yourself.
Are all data centers built the same?
No.
Every time you stream a TV show, check your bank balance, or send an email, a computer in a warehouse somewhere does the work of processing that information — known as data. That's why the warehouse is called a data center. To keep things simple, in this project we'll call them "regular" data centers. Thousands of them have quietly run the internet for decades. They are not new.
Inside, the computers are stacked floor to ceiling. The industry calls them servers — but a server is just a computer built for a rack instead of a desk, and the rack is simply the shelf it sits on. One "regular" data center holds thousands of these computers. Each individual computer is a modest energy user — one uses far less electricity than your house does.
Then came AI.
AI runs on a new, far more powerful kind of computer — too power-hungry for a "regular" data center to handle. A single AI computer uses more electricity than your entire house — and the biggest AI facilities run tens of thousands of them at once, 24/7. It needed a new kind of building: the AI data center.
Colossus 1 in Memphis is one of the biggest AI data centers in the United States, and it packs so many computers into one building that it uses as much electricity as roughly 225,000 homes — continuously, around the clock.
This is a story not about "regular" data centers, but about AI data centers — the ones in the news lately. Below, you can place one over your own neighborhood, count its floor space in Walmart Supercenters, weigh its power against homes — and its water against golf courses.
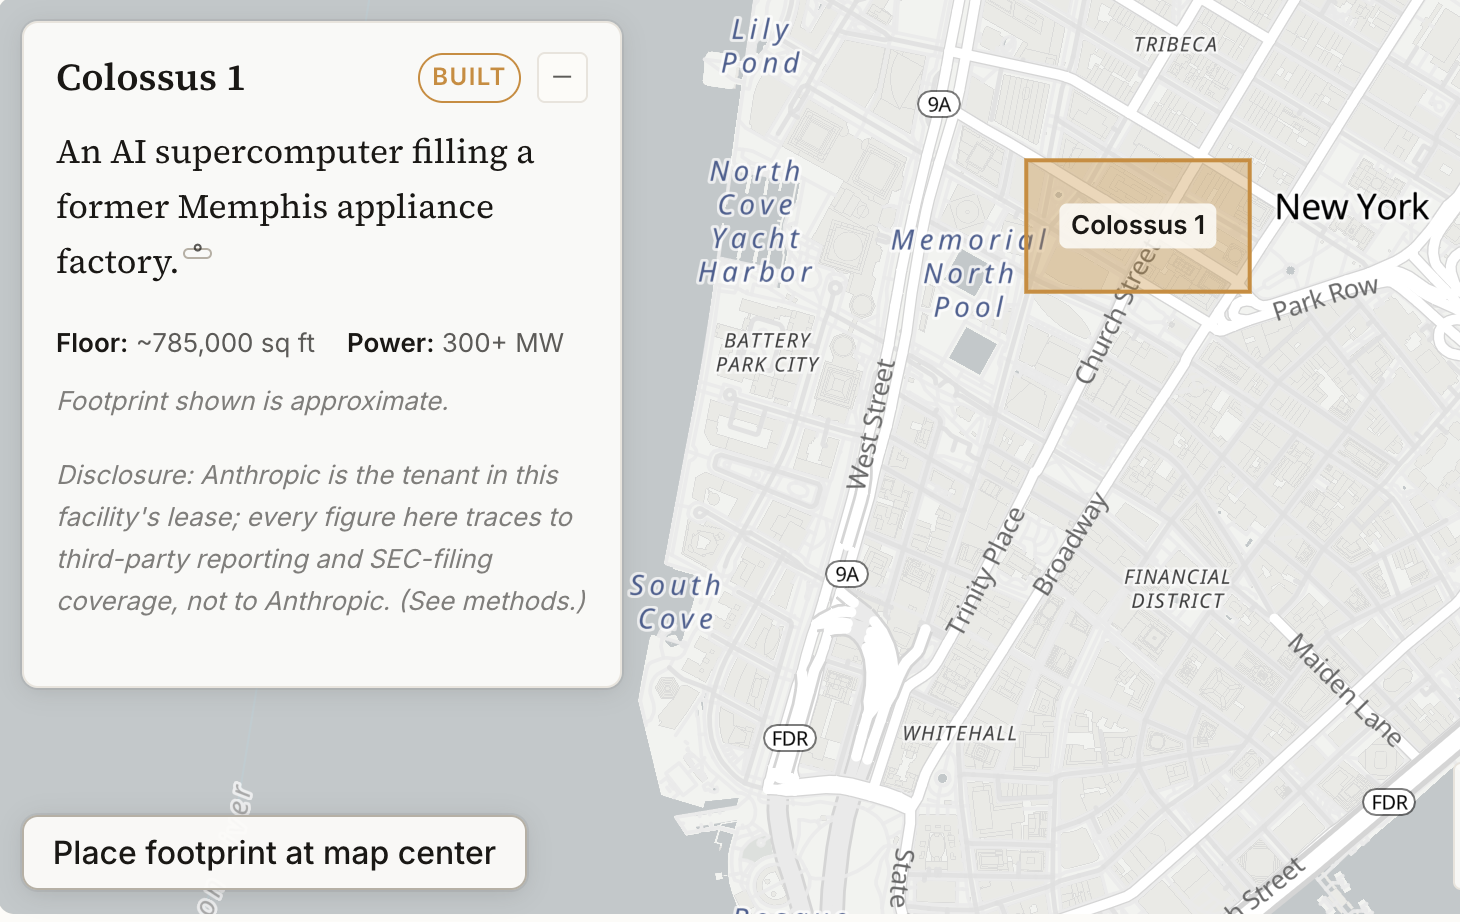
Drag a data center over somewhere you know
A data center is an abstraction until it's sitting on your street. Pick a facility, find a place you know, and drag the footprint across it — at true scale.
Meet the buildings
There are many AI data centers in the U.S. — but verifiable data on them is surprisingly hard to find. The four facilities below aren't a ranking: each was chosen because it tells part of the story, and because its numbers can be traced to public records. The fifth entry is an average "regular" data center, there for comparison.
Or pick one from the row below:
Drag the footprint over any place you know — or pan the map and tap “Place footprint.”
Data centers, measured in Walmart Supercenters
Square feet and square meters mean nothing to most people — especially in the hundreds of thousands. It's hard to picture just how big that is. But most people can picture a Walmart Supercenter, or a football field. Pick a data center below and see how many would fit inside it.
Data centers, measured in towns
Power is the number that actually defines the AI era. Below, the chosen facility's power draw — each symbol is a town of about 5,000 households.
In the city where you live, electricity use rises and falls with the season and the time of day. At 3 a.m., most people are asleep — so the city barely sips power. An AI data center never sleeps. It's always on, 24/7, drawing a load the size of a small city that never dips. The grid's quietest hour now carries a rush-hour burden — and the companies that run the grid have to build more power plants and lines to keep up — costs that show up on everyone's electric bill.
For scale: U.S. data centers already use more than 4% of all U.S. electricity, and federal projections say that share could roughly double or triple by 2028.
And then there's water
Hundreds of thousands of computers running 24/7 get hot. To cool them, many data centers do essentially what your body does: they sweat. Cold water is pumped past the hot computers, soaks up the heat, and much of it then evaporates away into the air — carrying the heat with it, and permanently using up the water. That's why data centers in this chapter are measured in gallons consumed, not borrowed.
Google's data center in Council Bluffs, Iowa consumed about 1 billion gallons in 2024 — the company's thirstiest site, by its own disclosure. (It's not on the map above for a simple reason: this chapter runs on water numbers, and Google is one of the only companies that publishes them, site by site. Most of the facilities you dragged don't disclose their water use at all.)
Nationally, U.S. data centers directly consumed about 17 billion gallons for cooling in 2023 — a figure projected to double or even quadruple by 2028. Seventeen billion gallons sounds like a lot. But compared to what? Let's look at golf courses, California's almond orchards — and the water leaking from America's pipes.
The numbers that went wrong
These numbers are hard. Some frightening figures fall apart on inspection; some reassuring ones quietly leave out the local reality.
Footprint, floor space, power, water. Every comparison above is true. None of them is the whole story — each is meant to add context and nuance. Now you can decide for yourself.
Methods & sources
How we counted
- Every figure is date-stamped and traces to a named source, shown in the ° chips throughout.
- Comparisons to Walmart Supercenters, football fields, homes and appliances are illustrative arithmetic — the base figures are inside each chip.
- Power is translated with the EIA household-average method (about 750 homes per megawatt of constant load), not the “1 MW = 1,000 homes” peak rule.
- Planned and designed capacity is never shown as built: those footprints are dashed and labelled, and approximate outlines say so.
Sources
Disclosure
This piece was reported and built by Gabriel Elizondo using AI tools, including Claude (made by Anthropic).
Anthropic is a party in the Colossus 1 story above — it is the tenant leasing the facility. Readers should weigh that. Every Colossus figure here traces to third-party reporting and SEC-filing coverage, not to Anthropic.
Illustrative comparisons (Walmart Supercenters, football fields, homes, towns) are labelled as such, with base figures in each chip.